Posts

Circle of Willis

Image
This illustration is a colored interpretation of the Circle of Willis found in angiogram images (small branches excluded). The layout includes an orientation of the scan level, as well as orthographic views of the arteries in a complete brain for context.
Image
This illustration is a colored interpretation of a disc herniation and osteophytes in a female patient's neck. The layout includes an orientation image to give viewers familiarity with the level of the scan.

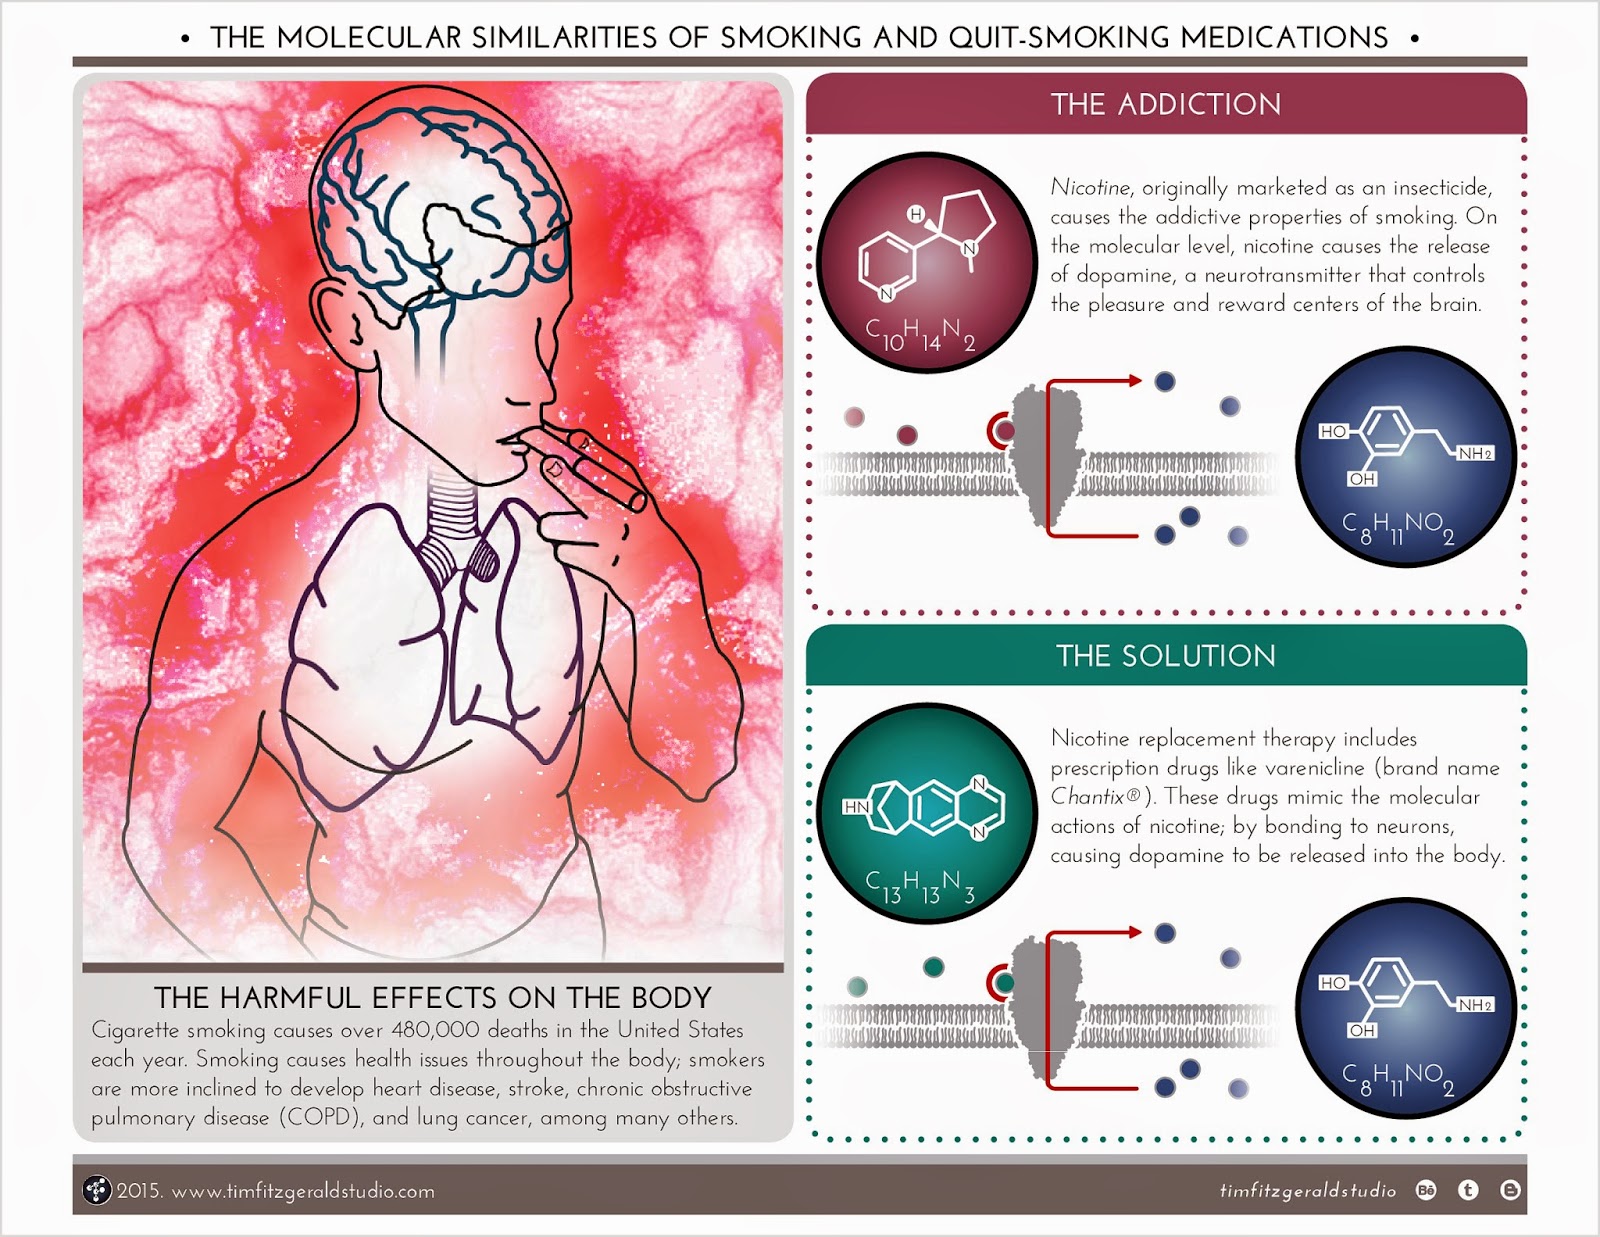
'Smoking and Quit-smoking' infographic

Image
This infographic compares the molecular similarities between smoking addiction and quit-smoking medications. In short, they both cause the release of dopamine (a neurotransmitter); the effects on health come down to how the body obtains the initial molecules to start the release.

MRI Interpretation

Image
This infographic shows different anatomical structures present in the original MRI image. Using a computer program, different layers of tissue were removed to reveal other ones; that is how different illustrations of different anatomical structures were made all from the same view.

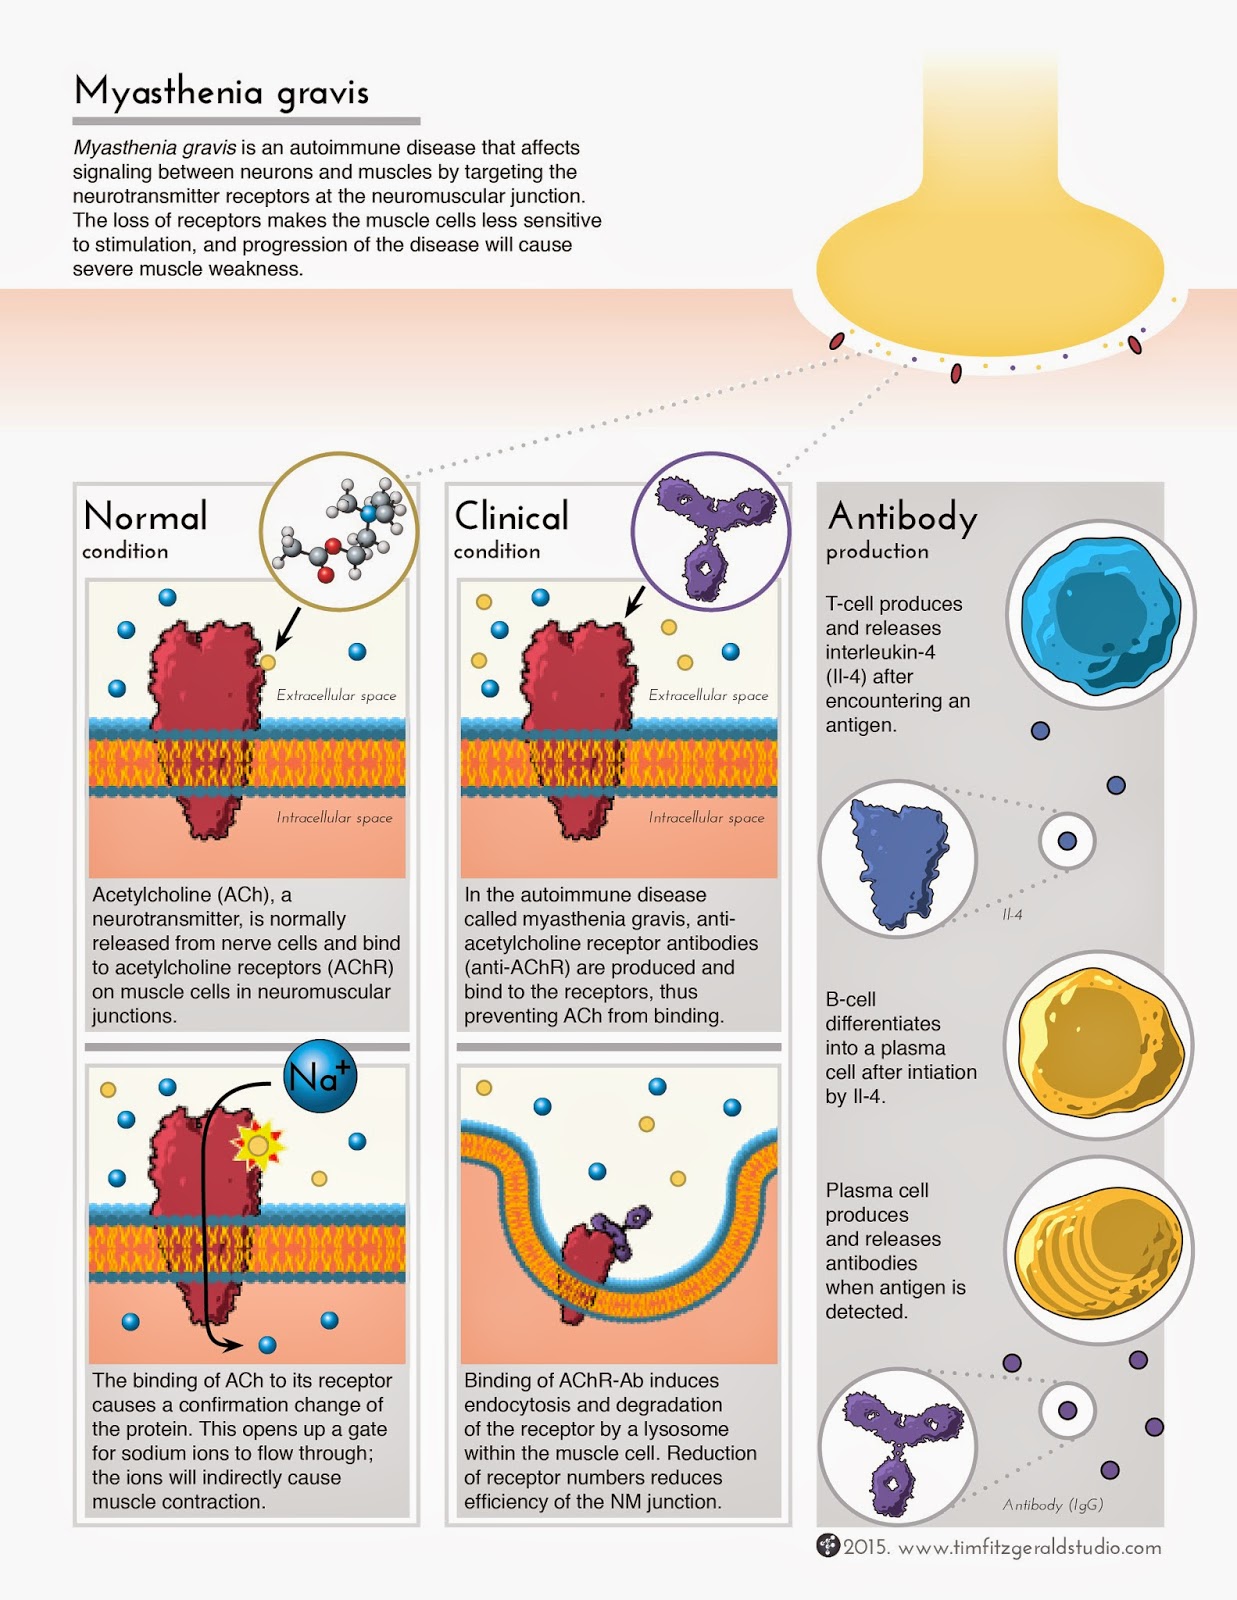
Myasthenia gravis infographic

Image
This infographic compares the normal condition of neuron-muscle communication, and the clinical condition of myasthenia gravis. The images show the molecular and cellular components involved with each circumstance.

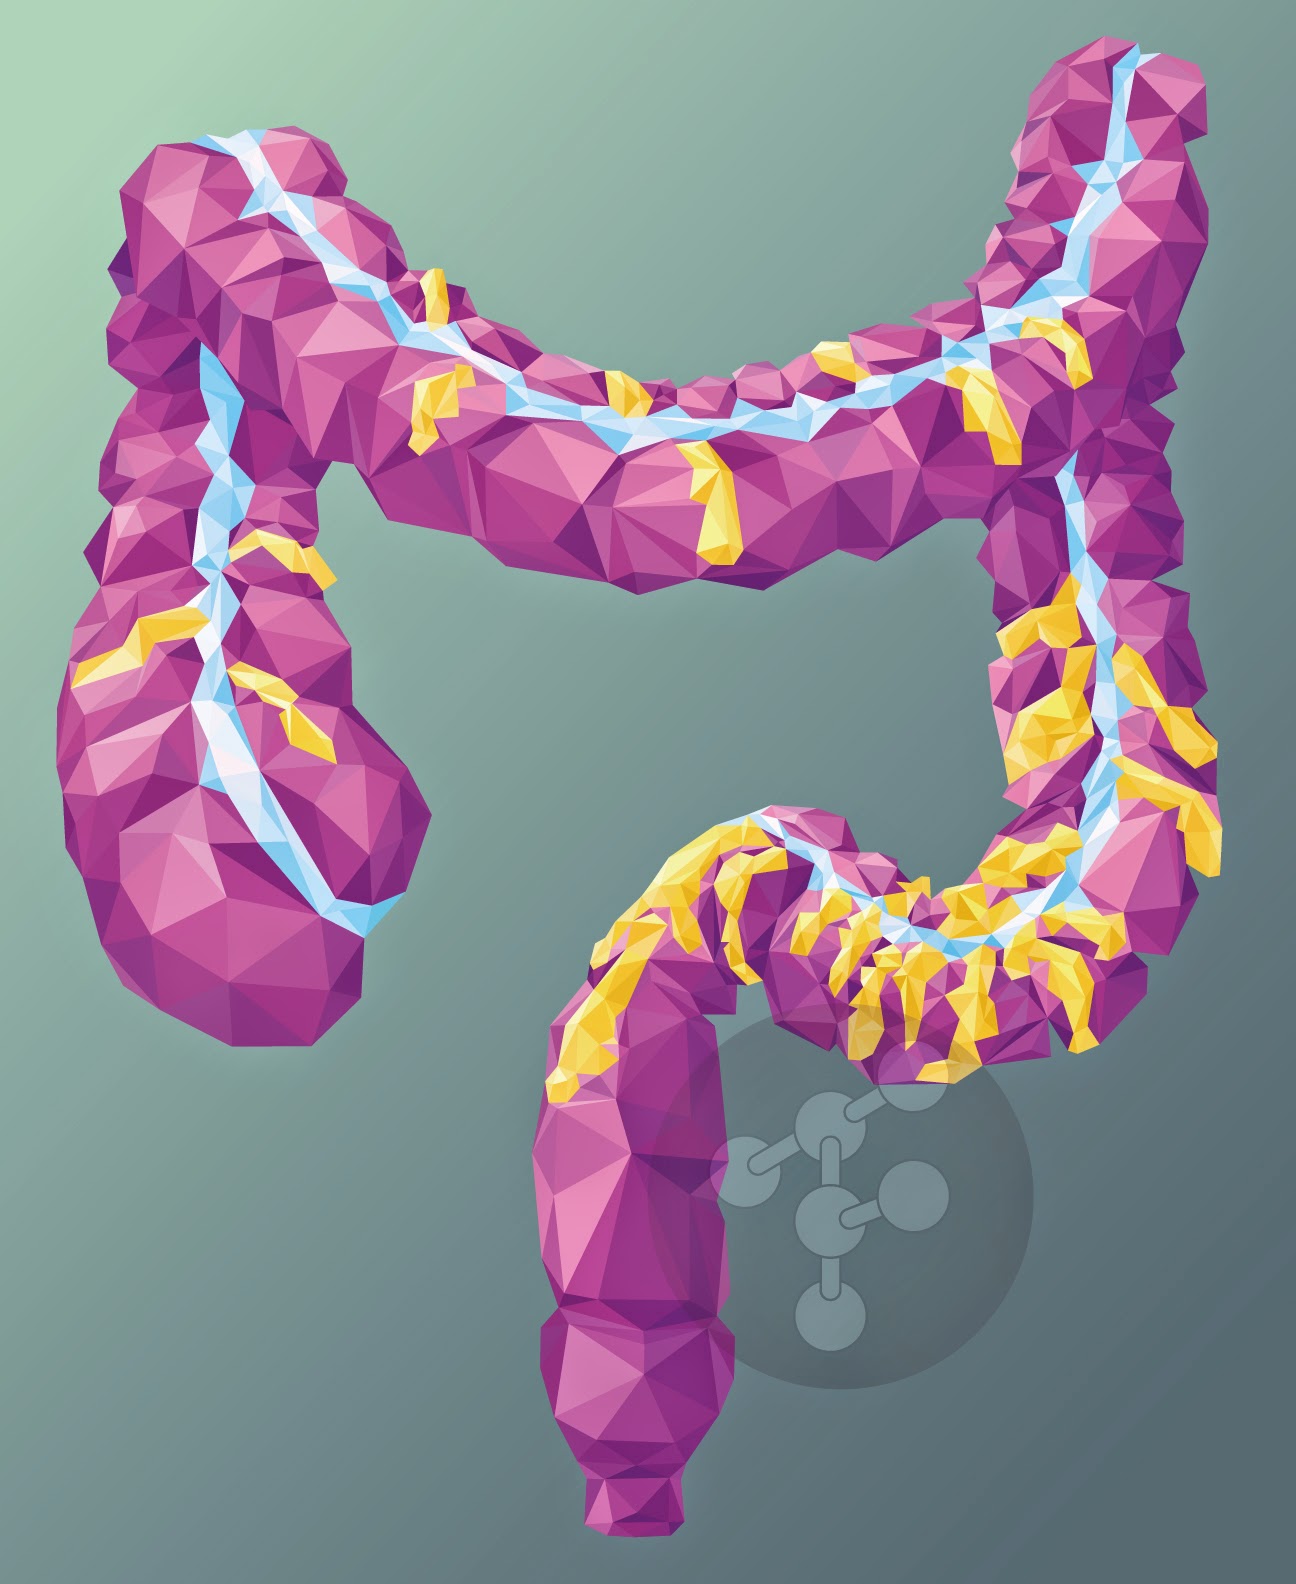
Low-poly Colon

Image
This low-poly image began as an experiment, but ended as a successful piece of artwork. Practical applications? Maybe just as an entertaining visual for patient education.

Church Committee Logo (proposed)

Image
This graphic is a proposed logo design for a local church committee; the group oversees the upkeep of buildings and landscaping around the church campus.